
Introduction
Sending emails is only half the job. Understanding how they perform while they are being delivered is what matters. With MigmaAI Sending Analytics, you can track every campaign in real time, monitor engagement as it happens, and use those insights to improve future campaigns automatically.
TL;DR
- Track opens, clicks, deliveries, bounces, unsubscribes, and complaints in real time
- View engagement trends with a live activity graph
- See where your audience is engaging with geographic analytics
- Investigate individual recipient activity with detailed logs
- Compare A/B test performance side by side
- Let MigmaAI learn from campaign results to improve future campaigns automatically
What's New
See Everything in Real Time
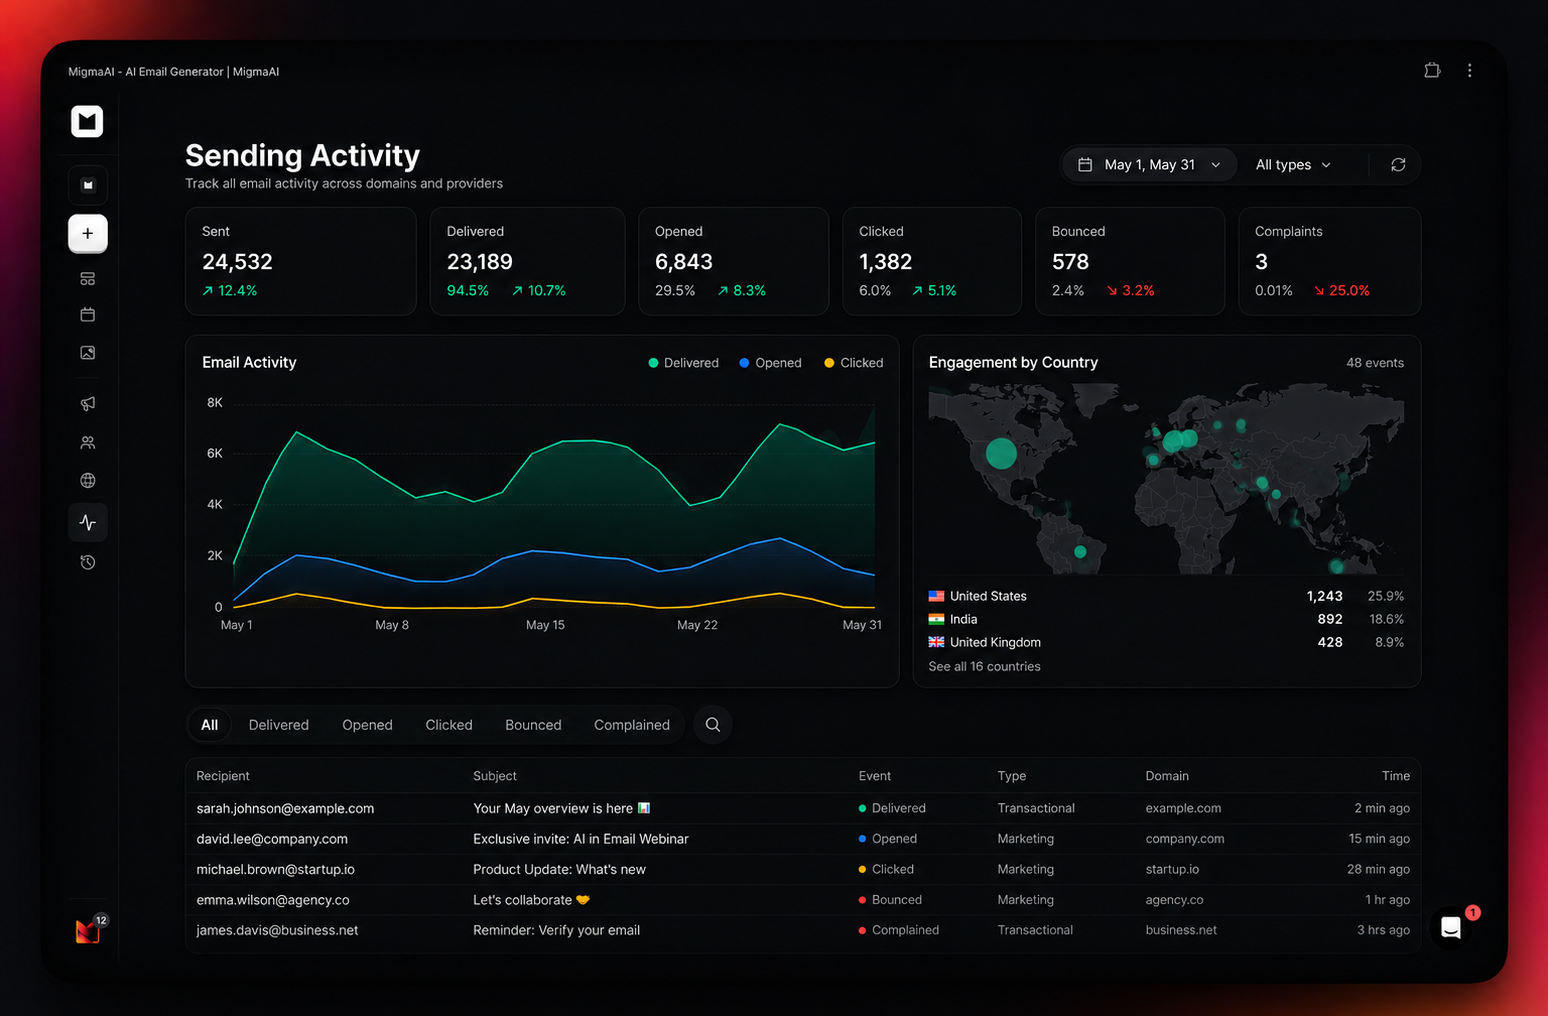
Once your campaign is live, the Sending Activity dashboard updates continuously as emails are delivered and recipients engage. Track sent, delivered, opened, clicked, bounced, unsubscribed, and complaint events in real time.
Filter by date range, email type, or domain to quickly find what you need.
Email Activity Graph
The activity graph visualizes delivered, opened, and clicked events over time in a single view. See when engagement peaks, where clicks increase, and how your campaign performs throughout the sending process.
Engagement by Country
The geographic map shows where opens and clicks are coming from across the world. Identify active markets and use that data to improve future targeting and scheduling.
Per-Recipient Logs
Recipient logs provide detailed visibility into every email event. Filter by Delivered, Opened, Clicked, Bounced, or Complained to investigate individual activity, delivery issues, or engagement behavior.
Each entry includes subject line, event type, domain, and timestamp.
A/B Test Results, Built In
If you run A/B tests, each variant includes its own performance metrics directly inside the dashboard. Compare open rates and click rates side by side to identify the winning version quickly.
MigmaAI also learns from these results automatically. Higher-performing subject lines, content structures, engagement timing, and successful variants help improve future campaigns over time.
From Data to Clarity
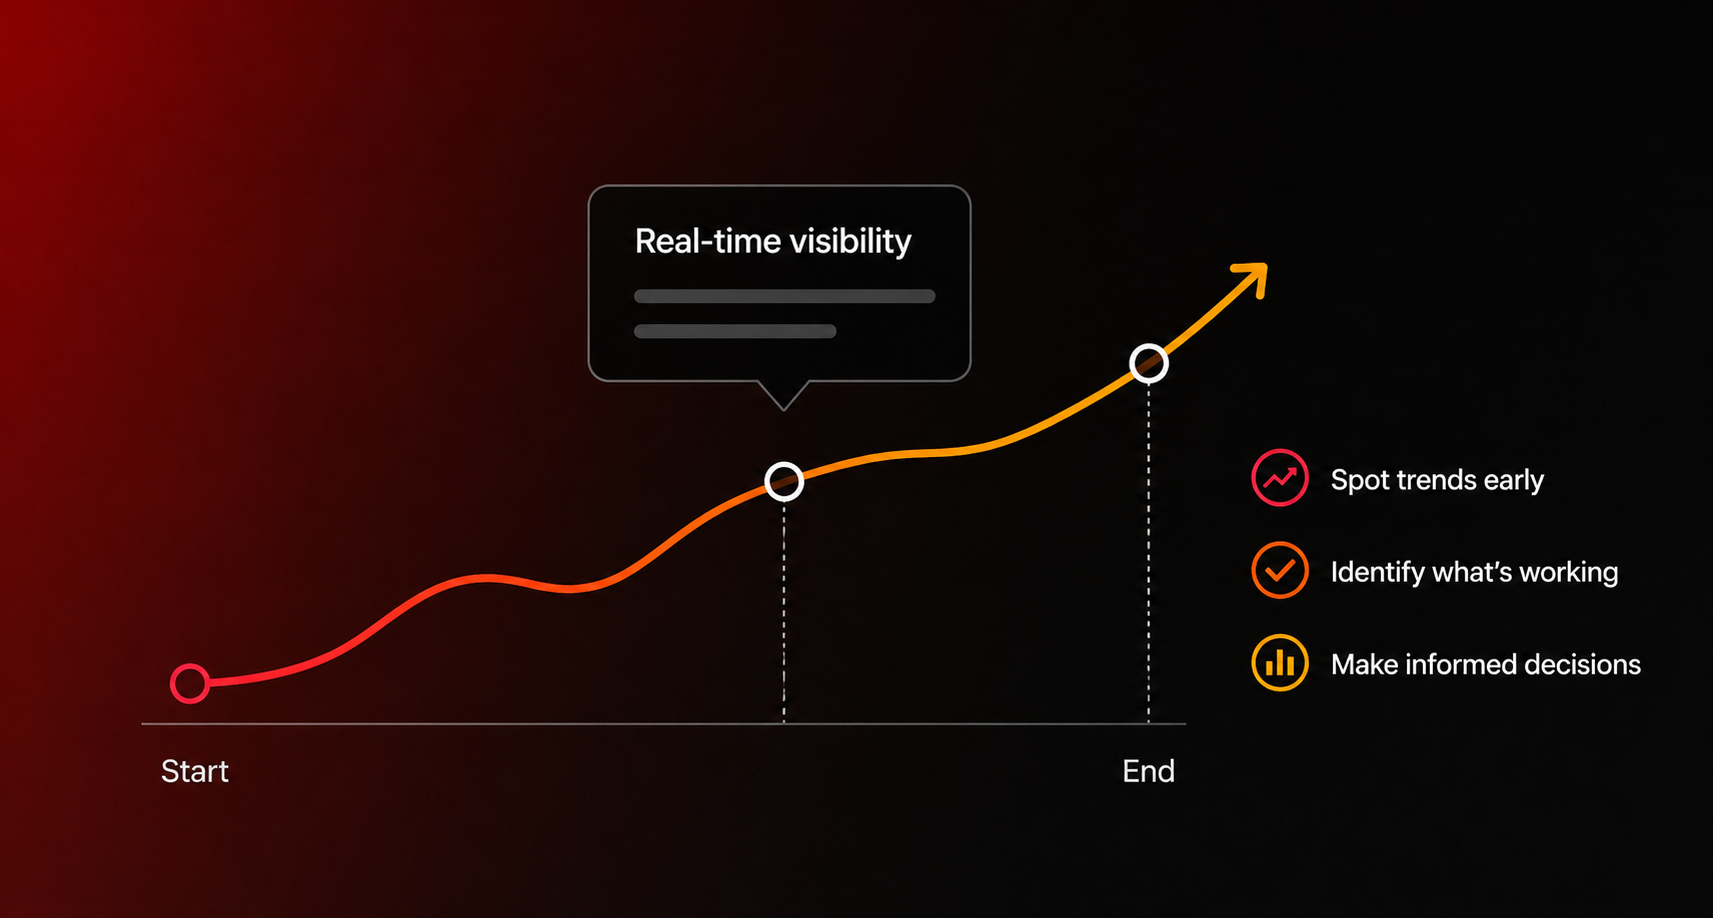
Sending Analytics is not just a reporting dashboard. MigmaAI continuously studies campaign performance, including engagement trends, deliverability, recipient behavior, and A/B testing outcomes.
These insights are automatically applied to future campaigns to help improve email quality, engagement, and overall performance.
The more you send, the smarter MigmaAI becomes.
What You Can Do Now
- Track delivery and engagement events in real time
- View campaign activity trends with live graphs
- Analyze audience engagement by country
- Investigate individual recipient activity
- Compare A/B test performance instantly
- Filter analytics by date range, email type, and domain
- Improve future campaigns automatically through AI learning
Built for Everyone
Whether you are running marketing campaigns, newsletters, or transactional emails, Sending Analytics gives you a single place to generate, test, monitor, and improve email performance.
Conclusion
With Sending Analytics, MigmaAI combines AI-powered email generation, A/B testing, real-time analytics, and continuous optimization in one platform.
Launch your next campaign and watch it perform in real time while MigmaAI learns how to make the next one even better.